InnoLIMS® for Production Facilities
Home /
InnoLIMS /
For Production
It's important to react quickly to deviations in production quality control; results outside quality limits must be spotted as soon as possible. It is also important to be able to monitor specified attributes of products, materials, and lots on a long timeframe. Another crucial factor in the competitiveness of production is cost-efficiency. InnoLIMS® lowers laboratory costs by reassigning routine work from workers to computers, and with cost monitoring. InnoLIMS makes quality control and product development easy with the features outlines below.
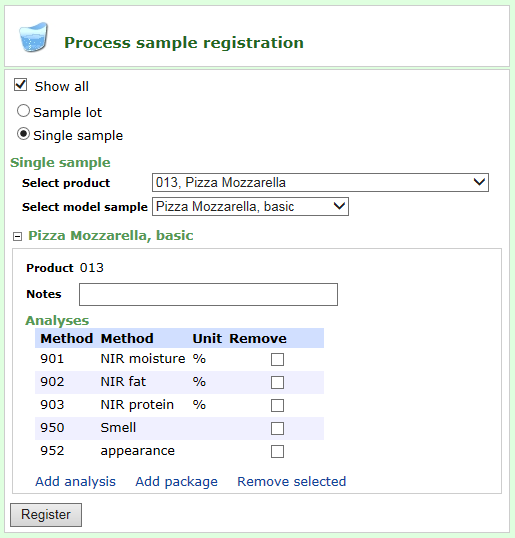
Sample Registration
In a quality monitoring process samples of a research object (for example product or material) are saved according to a monthly sampling plan. Measurements to be made from each sample are copied from template samples. Measurements can be added and removed from the samples. The analyses are printed on work lists and removed from them when the results are saved.
Lots
InnoLIMS can be used to keep track of products and their lots. Samples taken from a lot are shown on the lot entry in InnoLIMS. The system supports a product structure, where the user can find out which material lots have been used in producing a specific product lot.
Specifications
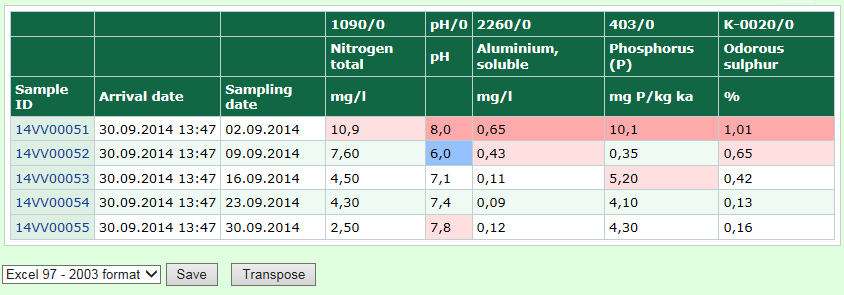
Quality limits can be defined for the attributes of different products and materials. The system immediately notifies the user if a result is outside limits. Different limits can be defined for different customers and lots. The limits can be shown on the X card, where the outliers are easy to spot. As a result, the outliers are marked with a distinctive background color in tables and table reports.
Research Objects' Reports
Products, materials, intermediate products and sample matrixes are handled in InnoLIMS as research objects. Different reports of a specified research object's results can be printed from different time periods. Results can be shown in a table. The user defines which measurements are shown for which research objects and if results are grouped by date.
A daily report can be printed for a research object, where all results from samples of a given research object are shown with an own page for each day. In addition to these, InnoLIMS includes a statistics report for a research object's measurement results. New reports can be tailored according to the customer's needs.
Graphics
InnoLIMS makes it possible to print out various graphs and graphiccal representations of data. In production, one of the most essential graphs is the X chart, which shows a specific product's results from a given method on a given timeframe. Quality limits can be shown on the X chart. Several attributes of the same research object can be plotted, or results from a given method can be compared among different research objects with the graph features in InnoLIMS.
InnoLIMS® also includes a graph generator for user-defined graphs. The X axis can be time, an equal interval axis or an attribute saved to the sample. The correlation of different attributes can thus be followed.
Reclamation Management
InnoLIMS can be used as part of reclamation management. It is easy to see which lot a deficient product belongs to and what results have been measured from the lot. Measurements from the product can be compared with earlier measurements from the lot. This way it is easy to find out if the product is authentic and how the product has changed during storage time.
Other samples from the lot, its components and further products can be traced through reclamation management as well. This way the user can examine the origin of the defect and how broadly it has affected other production lots. Once the reclamation has been analyzed, a report can be generated for the customer with data of the product's alleged deficiency.
Statistics
InnoLIMS gathers information about its use in statistics. The statistics can be used to monitor the duration of an analysis or duration of the whole workflow of a sample from sampling to reporting. This information helps develop efficiency in laboratory operations.