InnoLIMS

InnoLIMS General For Service Laboratories For Research For Production User Interfaces

InnoLIMS for Research Laboratories

Home / InnoLIMS / For Research

In research it is important to be able to manage different projects and find solutions to problems. In InnoLIMS® all the documents and results are found easily and can be compared with each other. InnoLIMS® benefits research laboratories especially with the following features.

Projects and Sub-Projects

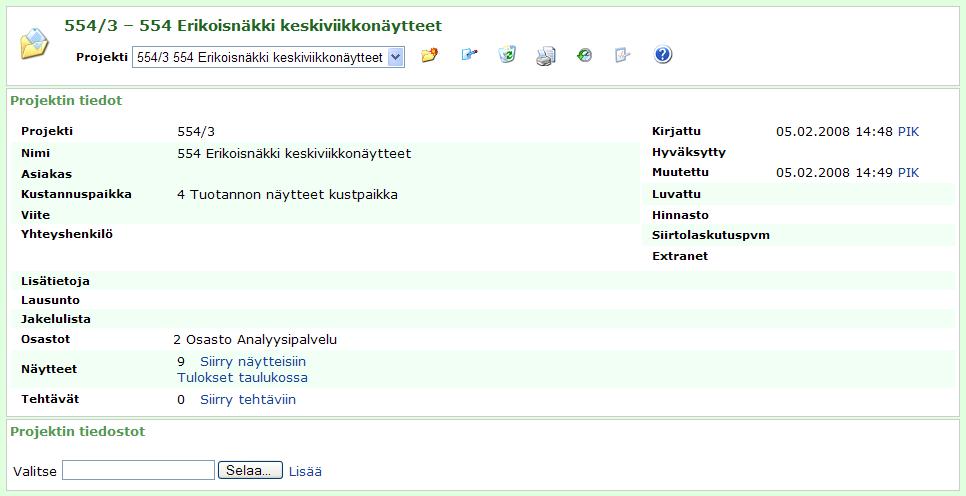
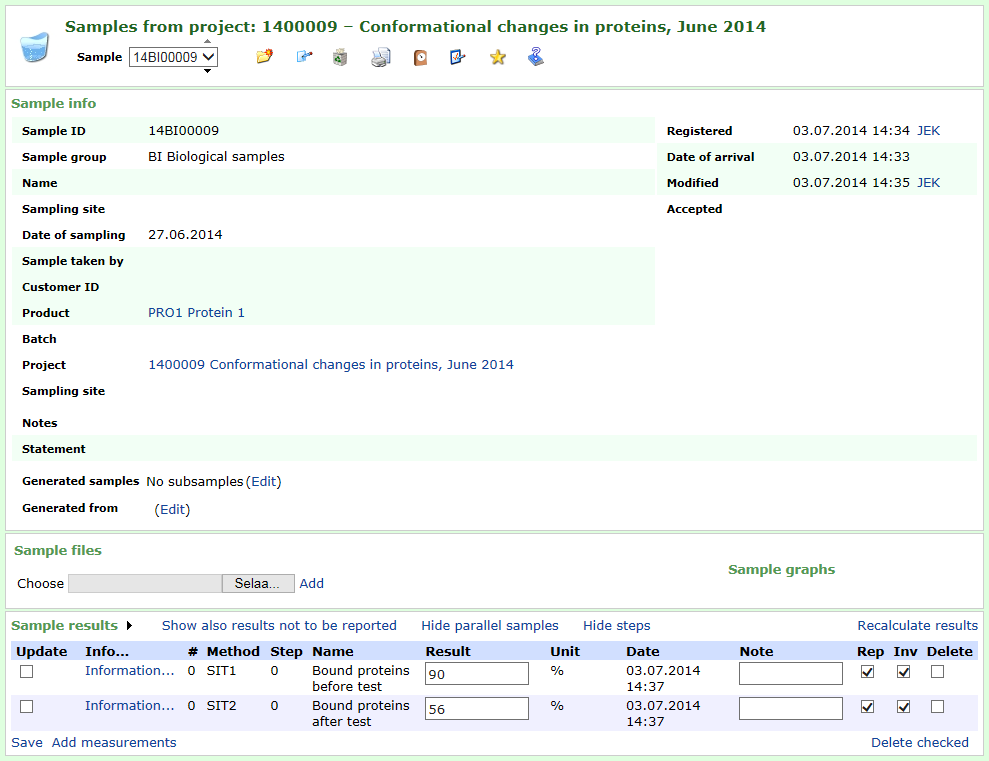
Samples are saved in InnoLIMS to projects or their subprojects. These help to group samples and tasks into manageable wholes. Projects, samples and research objects have electronic archives where files in any format can be saved, for example instrument spectra, photos or documents.

Information about costs can also be saved for projects, to help keep track of finances. Projects can be reported in several formats, including user-made ad hoc ones. Reports can be saved as a pdf files with an electronic signature and automatically sent to set e-mail addresses or made available via Extranet. The report can be saved with an electronic signature.

Screen capture of Sample Management

Sample Management

Samples can be registered in InnoLIMS® from scratch or they can be copied from template samples or earlier samples. When samples are registered, they will get unique sample ID's. This ensures that the sample is traceable and cannot be confused with any other sample. Labels with barcodes can be printed for samples. Single analyses or analysis packages can be registered for samples. The samples can be copied and sample information can be entered to several samples at a time. After this the samples are shown on work lists and sample queues.

When results are registered, the analyses are no longer included in work lists. The system calculates mean and standard deviation values automatically from parallel measurements. Sample status can be monitored constantly. The calculation module InnoCalc calculates results automatically from measured values using user-defined calculation formulas. Continuation samples can be registered and different samples can be combined as a composite sample. The samples include an electronic archive for attachment files, such as cover letters and spectra.

Screen capture of Samples

Sample Groups

Samples are divided into sample groups. Examples of sample groups are soil samples, water samples, microbiological samples and calibration and quality control samples. The user can define what information is shown on the sample form according to the sample group. For example, soil samples can be opened on a form that shows the sample's grain size curve.

Research Plan

A research plan can be made with InnoLIMS. This includes a sampling calendar for planning when to take the needed samples. Tasks can also be registered in the research plan.

Reports

Results saved in InnoLIMS can easily be shown on reports, in tables and as graphical representations. Tables of results can be transferred to Excel for further management. The X axis on reports can represent time, any attribute of a sample, or a circumstance at time of sampling. With this the user can monitor correlation between different attributes.

Graphs can also be printed from results of a research object or sampling site. Attributes of different research objects or projects can be compared by plotting several of them on the same graph. Special graphs, like grain size curve, are also possible with InnoLIMS.

Kuvituskuva